Top Facebook Analytics Every Marketer Needs To Know Nowadays
Facebook Analytics is more than just a trend nowadays.
As described by Facebook, the Facebook analytics tool:
“...allows you to measure, understand, and optimize the interactions people have with your business across both devices and channels to help drive meaningful growth. With over 2 billion people on Facebook, our analytics solution provides rich, unique audience insights, powerful reports like conversion funnels and retention curves, and automated insights.”
If you are new to Facebook Analytics, there is a long road in front of you. And if you are active but don’t know how to explore more of its superpowers, you have landed on the right page.
Today, we are gathering the insights from the Social Media podcast by SocialMediaExaminer in which they are interviewing Andrew Foxwell, a Facebook ads expert running an agency for direct response eCommerce brands.
What Is Facebook Analytics?
The best way to introduce Facebook Analytics is as a program that allows you to see how your Facebook properties connect, who visits your page and what is their activity on it. You also get to see how people interact with your website and monitor the navigation of your users around it.
Facebook Analytics can be found in the Ads Manager or Business Manager section of your profile. It is a tool that pulls together all the micro data from your Facebook Page so that you see how people interact with your page and website over time.
Getting Started With Facebook Analytics
The most basic way to use Facebook Analytics starts with simply opening the tool and selecting your Facebook pixel. The pixel gives you a lot of interesting data and can be a great starting point.
As soon as you get to it, you can create an event source group (ESG) which will pull together disparate properties – or create one that includes more data sources. The main advantage here is the fact that you can truly see your return on investment (ROI) of your Facebook page and other elements of your marketing.
You can also share ESGs so other people in your business can gain access to the Facebook Analytics data. After you create them, you can share it via Business Manager or add people to your ESGs.
1. The Overview Dashboard
The Overview dashboard is created by Facebook Analytics automatically. This is the main dashboard through which you can take action in a number of ways. From here, you can also see the number of new users who liked your page, the number of unique users as well as the retention rate (the % of people who return to your site).
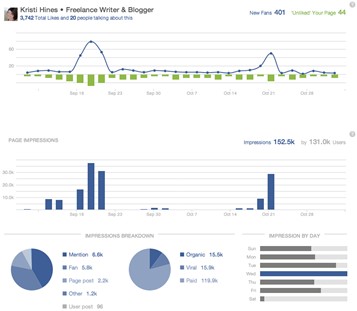
If you use Google Analytics, you will notice a change in the view compared to Facebook Analytics. However, the numbers and verbiage are quite the same and lining up.
2. Funnel Analysis
The Funnels dashboard helps you build visual paths within your sales cycle – and see how different parts of your funnel relate to one another. If you want to build your own funnel, you should click on ‘Create Funnel’ and select each event that you want to include in a sequential order.
When you add the funnel step, you are able to see the options like conversations, page views, post reactions, messages sent and other actions via the drop-down menu. This is how you can also see ways to improve the funnel.
For example, you can try to improve the percentage of people who view your page and then add something to a card. The best way to do that is to make the offer (or your ad) more enticing – and you will likely see a positive improvement.
You can also decrease the rate for actions. For example, if people are dropping out of your funnel at each stage (and you are losing people on your landing page), you can take action and improve that page – again to likely see a positive improvement over time.
Note: For the Funnels dashboard to work, you should make sure that your Facebook events are set up properly – and customize them for your needs and goals.
3. Customer Lifetime Value Analysis
This is another interesting angle that can help you target the right customers. For example, if you are selling a $100 product and want to spend $20 per customer on acquiring buyers, you can see how much you are actually spending – or who is buying your products. This way, you can raise your customer LTV (lifetime value) and track the performance over time.
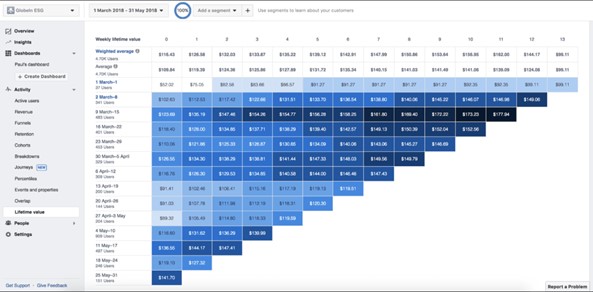
If you highlight the most important weeks (based on your sales), you can see how your LTC corresponds to the changes that you made in your targeted ads. Hence, you will see the improvement (or failure) of your ads, promotions etc.
4. Customized (Omni-channel) Dashboards
Facebook Analytics also lets you customize your dashboards. To do this, you first need to customize a graph and name your dashboard – as well as share it with a client through a unique URL link.
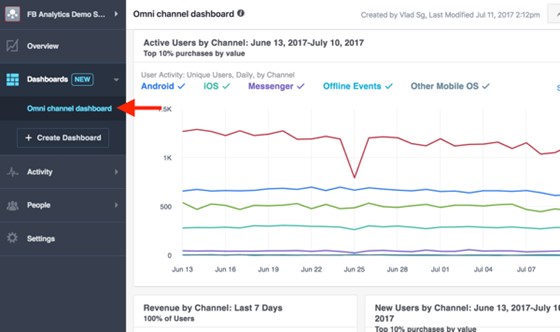
A customized dashboard can let you slice and dice your data in all kinds of ways. For example, you can customize the dashboard to show data for a specific period of time (ex. after changes are made) or one that compares specific events (ex. ones related elated to your company).
Are Facebook Analytics Better Than Google Analytics?
Obviously, comparing Facebook Analytics to Google Analytics is like comparing apples to oranges – mostly because they cater to different groups and actions.
However, what many people like about Facebook Analytics is the following:
- The ability to focus on people and not devices
- The cross-device measurement and analytics through funnels, cohorts and segments
- The Events Source Groups (ESGs) which lets you unify your website, app, page, Messenger and more (as described above)
- The omni-channel custom audiences that you can create and organize accordingly
- The automated insights – which is still in beta version but lets you see valuable data and trends to help you focus your efforts in the right way
As you can see, Facebook analytics lets you close the loop between your online and offline channels. At the same time, it gives you a chance to see the specific actions of each users and how they translated into sales, actions or registrations on your website.
Final Words
In the end, it is safe to say that Facebook analytics has gone a long way over the years. Today, we just scratched the surface of possibilities of the tool – but also introduced you to all of its superpowers.
The best way to master it is by playing around with it, seeing all the features in detail. And most importantly, testing it across your audience.
We hope that this article helped you make most of your Facebook page analytics through one of the most popular tools designed specifically for that purpose.